Server Activity Monitor
M-Files Admin includes a tool called Server Activity Monitor for observing events, processes, and tasks executed by vault users or M-Files Server. The tool enables you to easily identify possible issues related to operations taking place on the server.
This topic describes the various views included in the monitoring tool, but let's first see how to access Server Activity Monitor in M-Files Admin.
To open the server monitoring tool:
- Open M-Files Admin.
- In the left-side tree view, expand a connection to M-Files server.
- Click Server Activity Monitor.
As a result, you should see the activity monitor on the right side window of M-Files Admin.
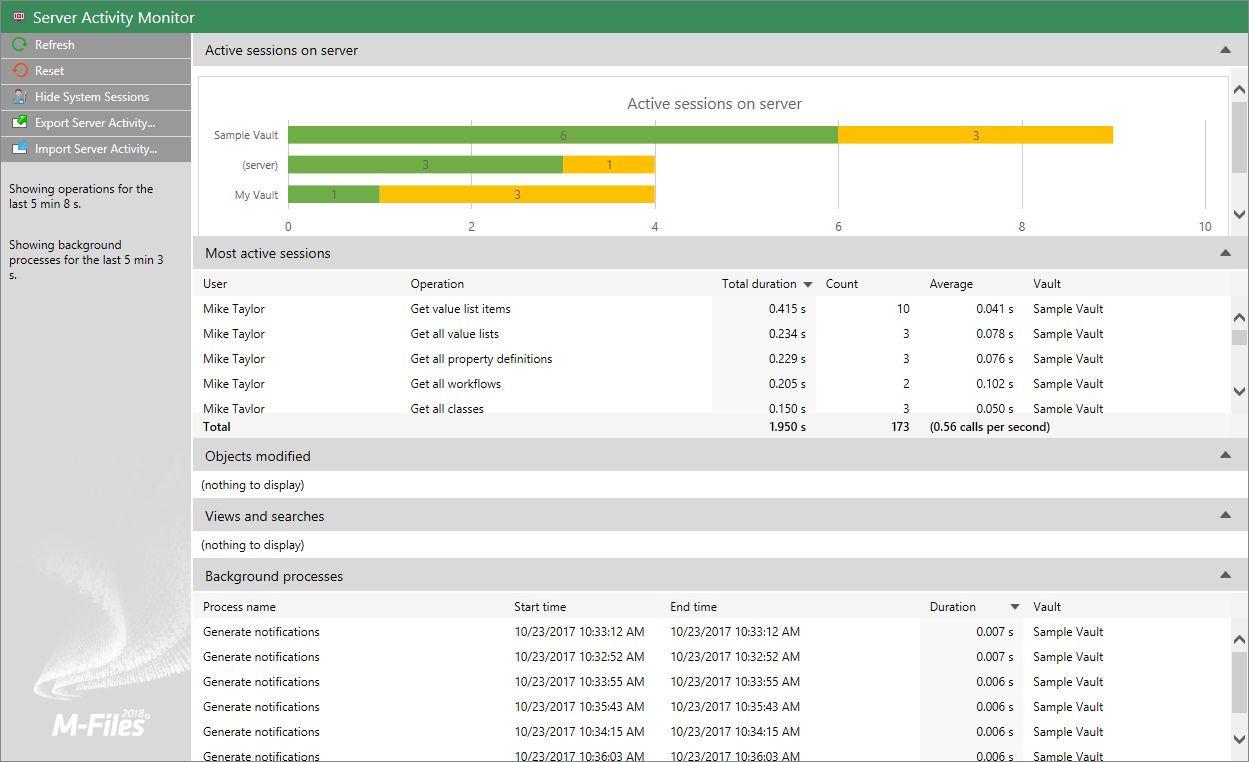 Server Activity Monitor in M-Files Admin.
Task pane commands
The commands on the task pane allow you to perform various operations in Server Activity Monitor:
- Refresh updates the server activity data with up-to-date information.
- Reset removes all the existing server activity data and restarts the monitoring.
- Show System Sessions / Hide System Sessions shows or hides active system sessions and operations. If system sessions are hidden, only user activity is shown.
- Export Server Activity... allows you to export the current server activity data to a JSON file.
- Import Server Activity... allows you to import and view server activity data previously exported to a JSON file.
Active sessions on server
This view lists all the active user and system sessions by vault connection. If the connection is listed as (server), the connection is not to any of the vaults, but to the server itself.
Most active sessions
This view lists the total number (Count) and duration of operations (Total duration) by user, the description of the operation (Operation), the average duration per operation (Average), and the vault connection (Vault).
Objects modified
This view displays the number of object modifications by user and vault.
- object creation
- object modification
- object deletion
Views and searches
This section lists the views accessed and searches initiated by the user. It displays the total duration, the number of uses, and the average duration per use of a single view (such as Recently Accessed by Me) or a search. Each row displays the user who accessed the view or performed the search, as well as the vault in which the operation was performed.
Background processes
The Background processes view lists activities automatically executed by M-Files Server, such as scheduled maintenance tasks and processing of automatic state transitions. In addition to the name of the process, the view displays the affected vault, as well as the duration, the last start time, and – for periodic events – the next start time of the process.